Dashboard Guide
The AuthData Audit Dashboard is a NextJS application that provides visual exploration of audit results, including action timelines, request/response viewers, and summary reports.
Overview
The dashboard reads JSON output files from the audit engine and presents them in an interactive web interface.
Dashboard Home
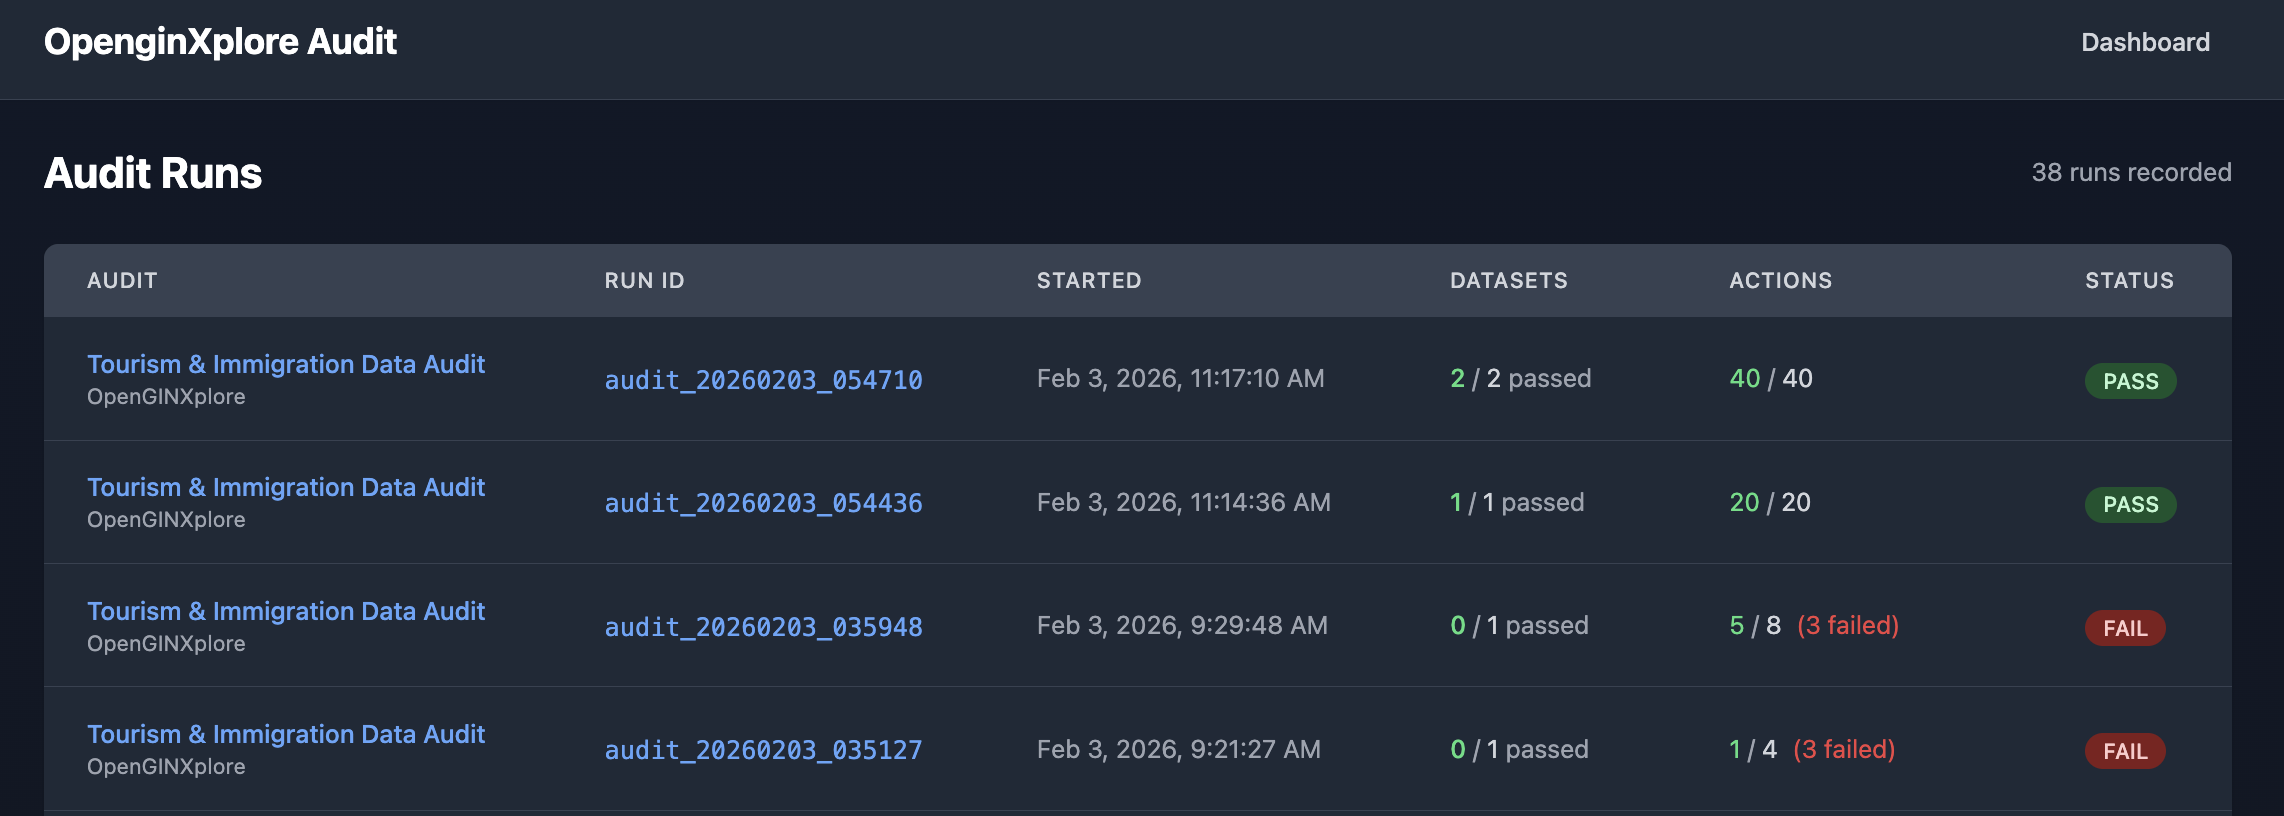
The home page displays a list of all audit runs with their status, showing pass/fail indicators, action counts, and timestamps.
Run Details View
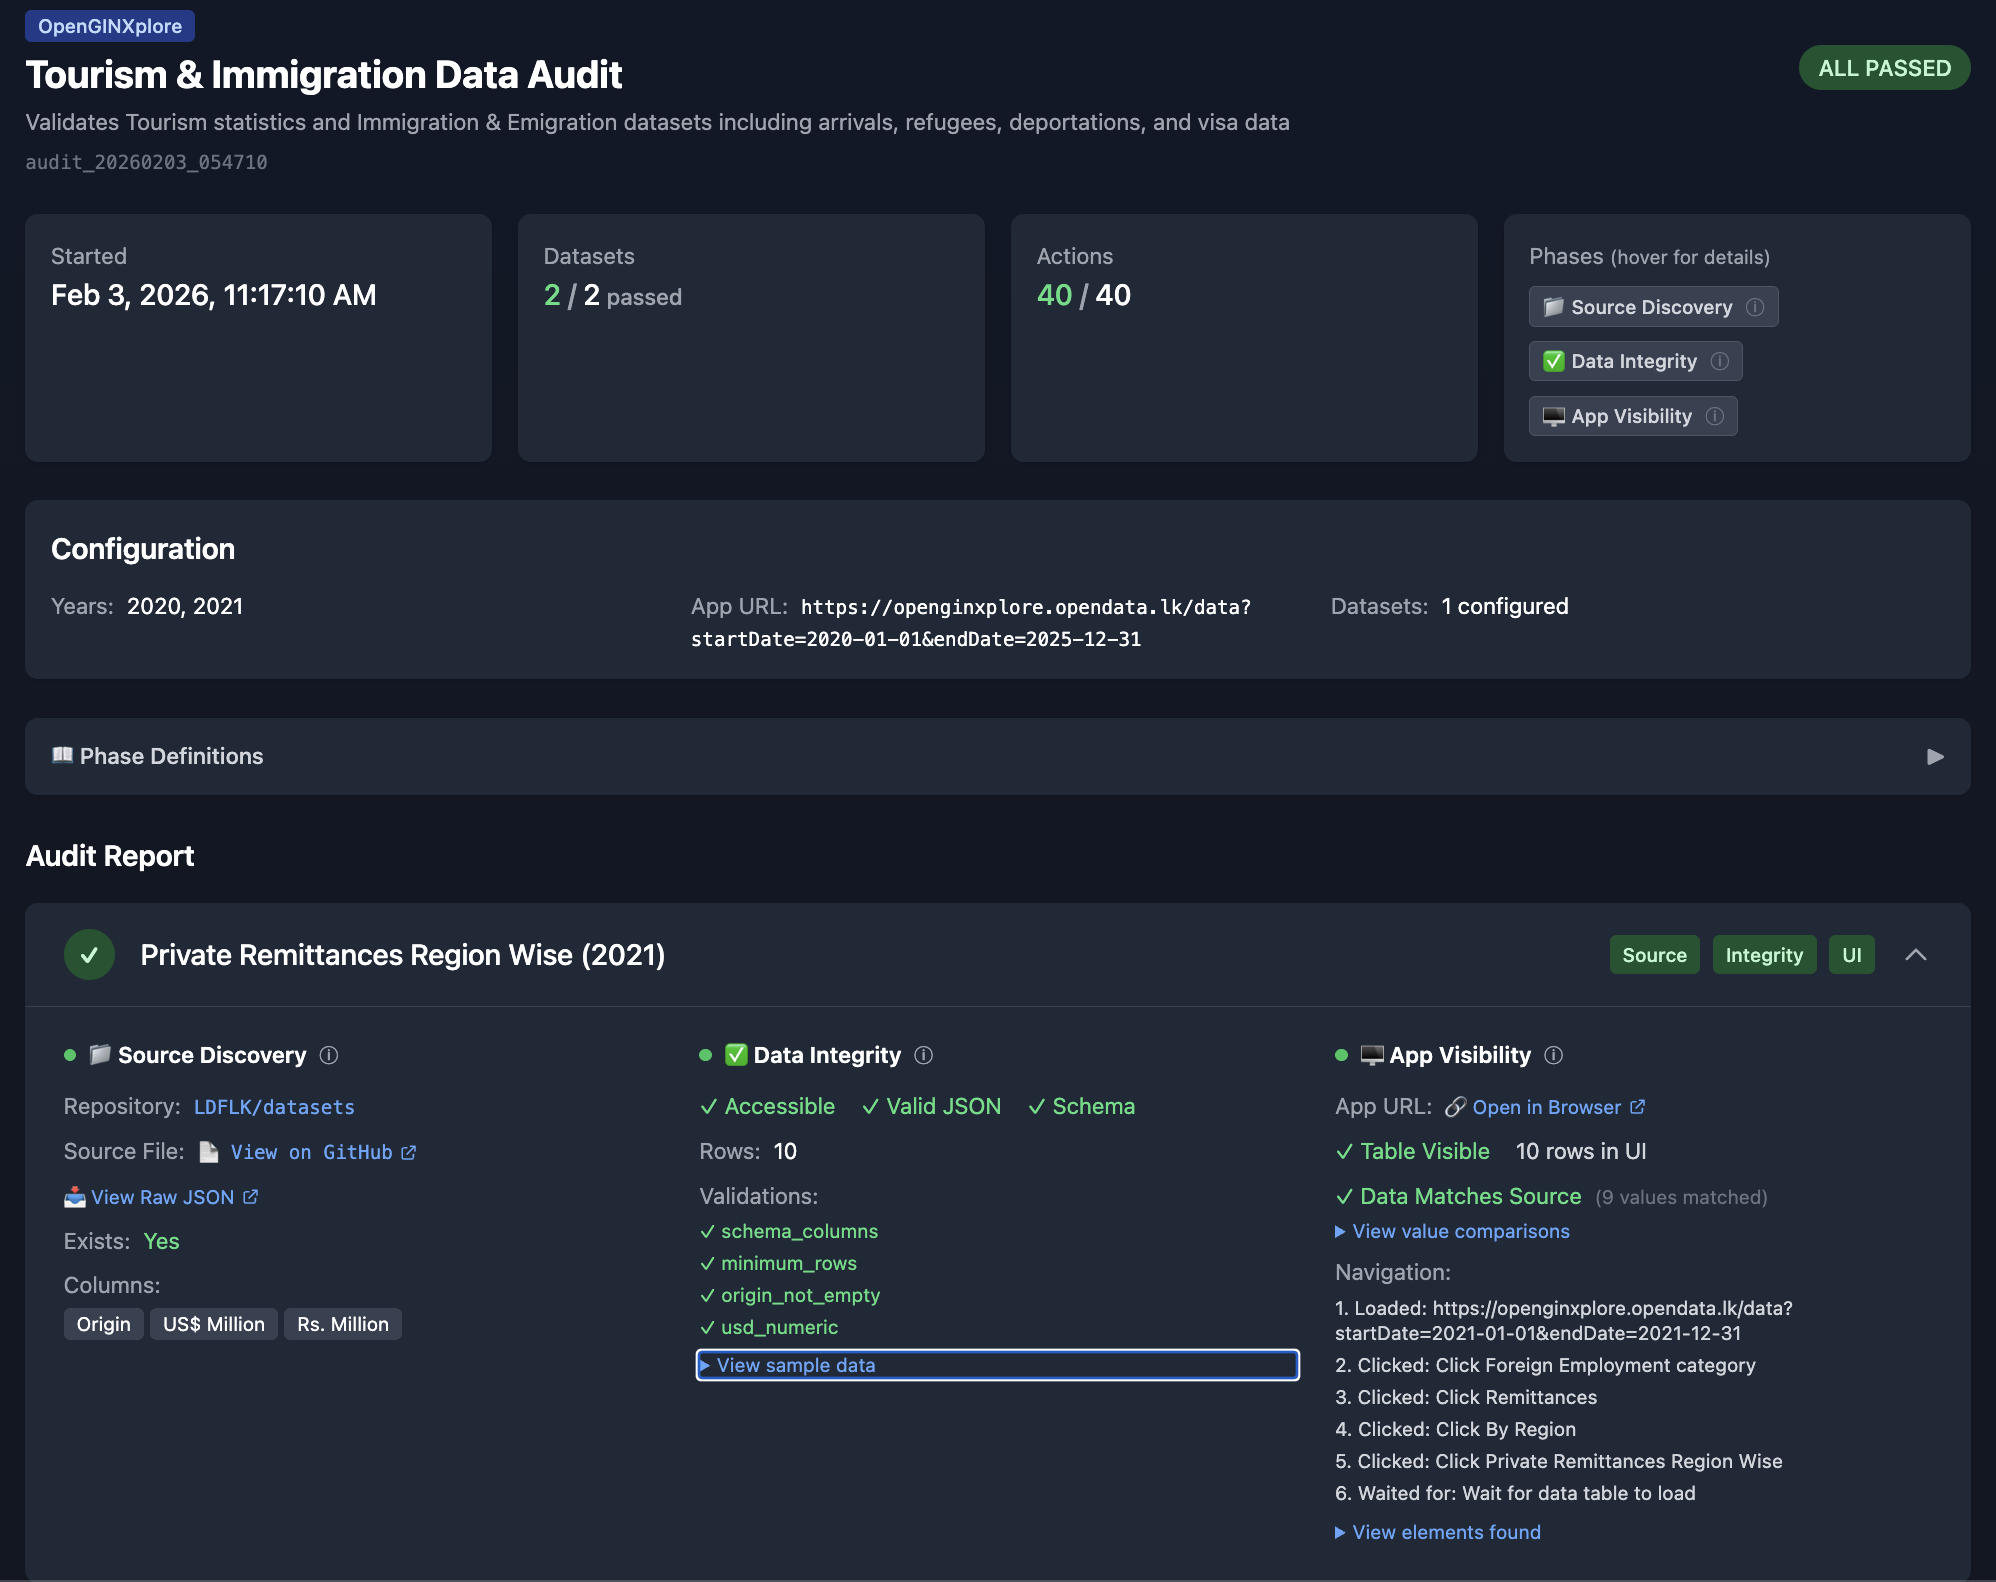
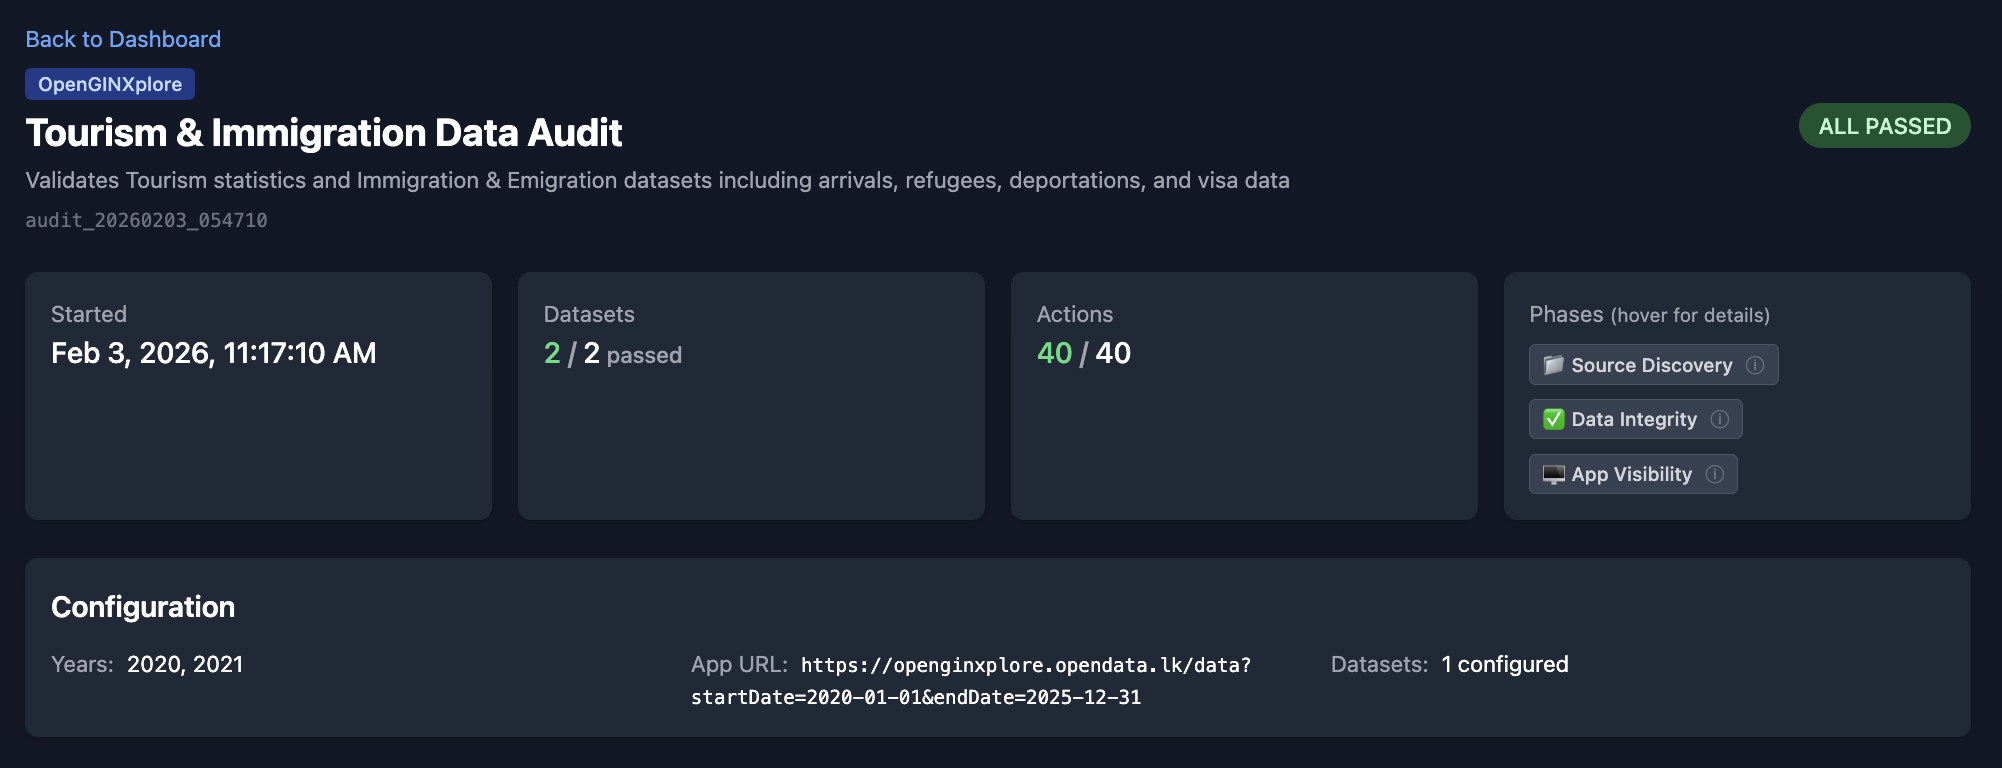
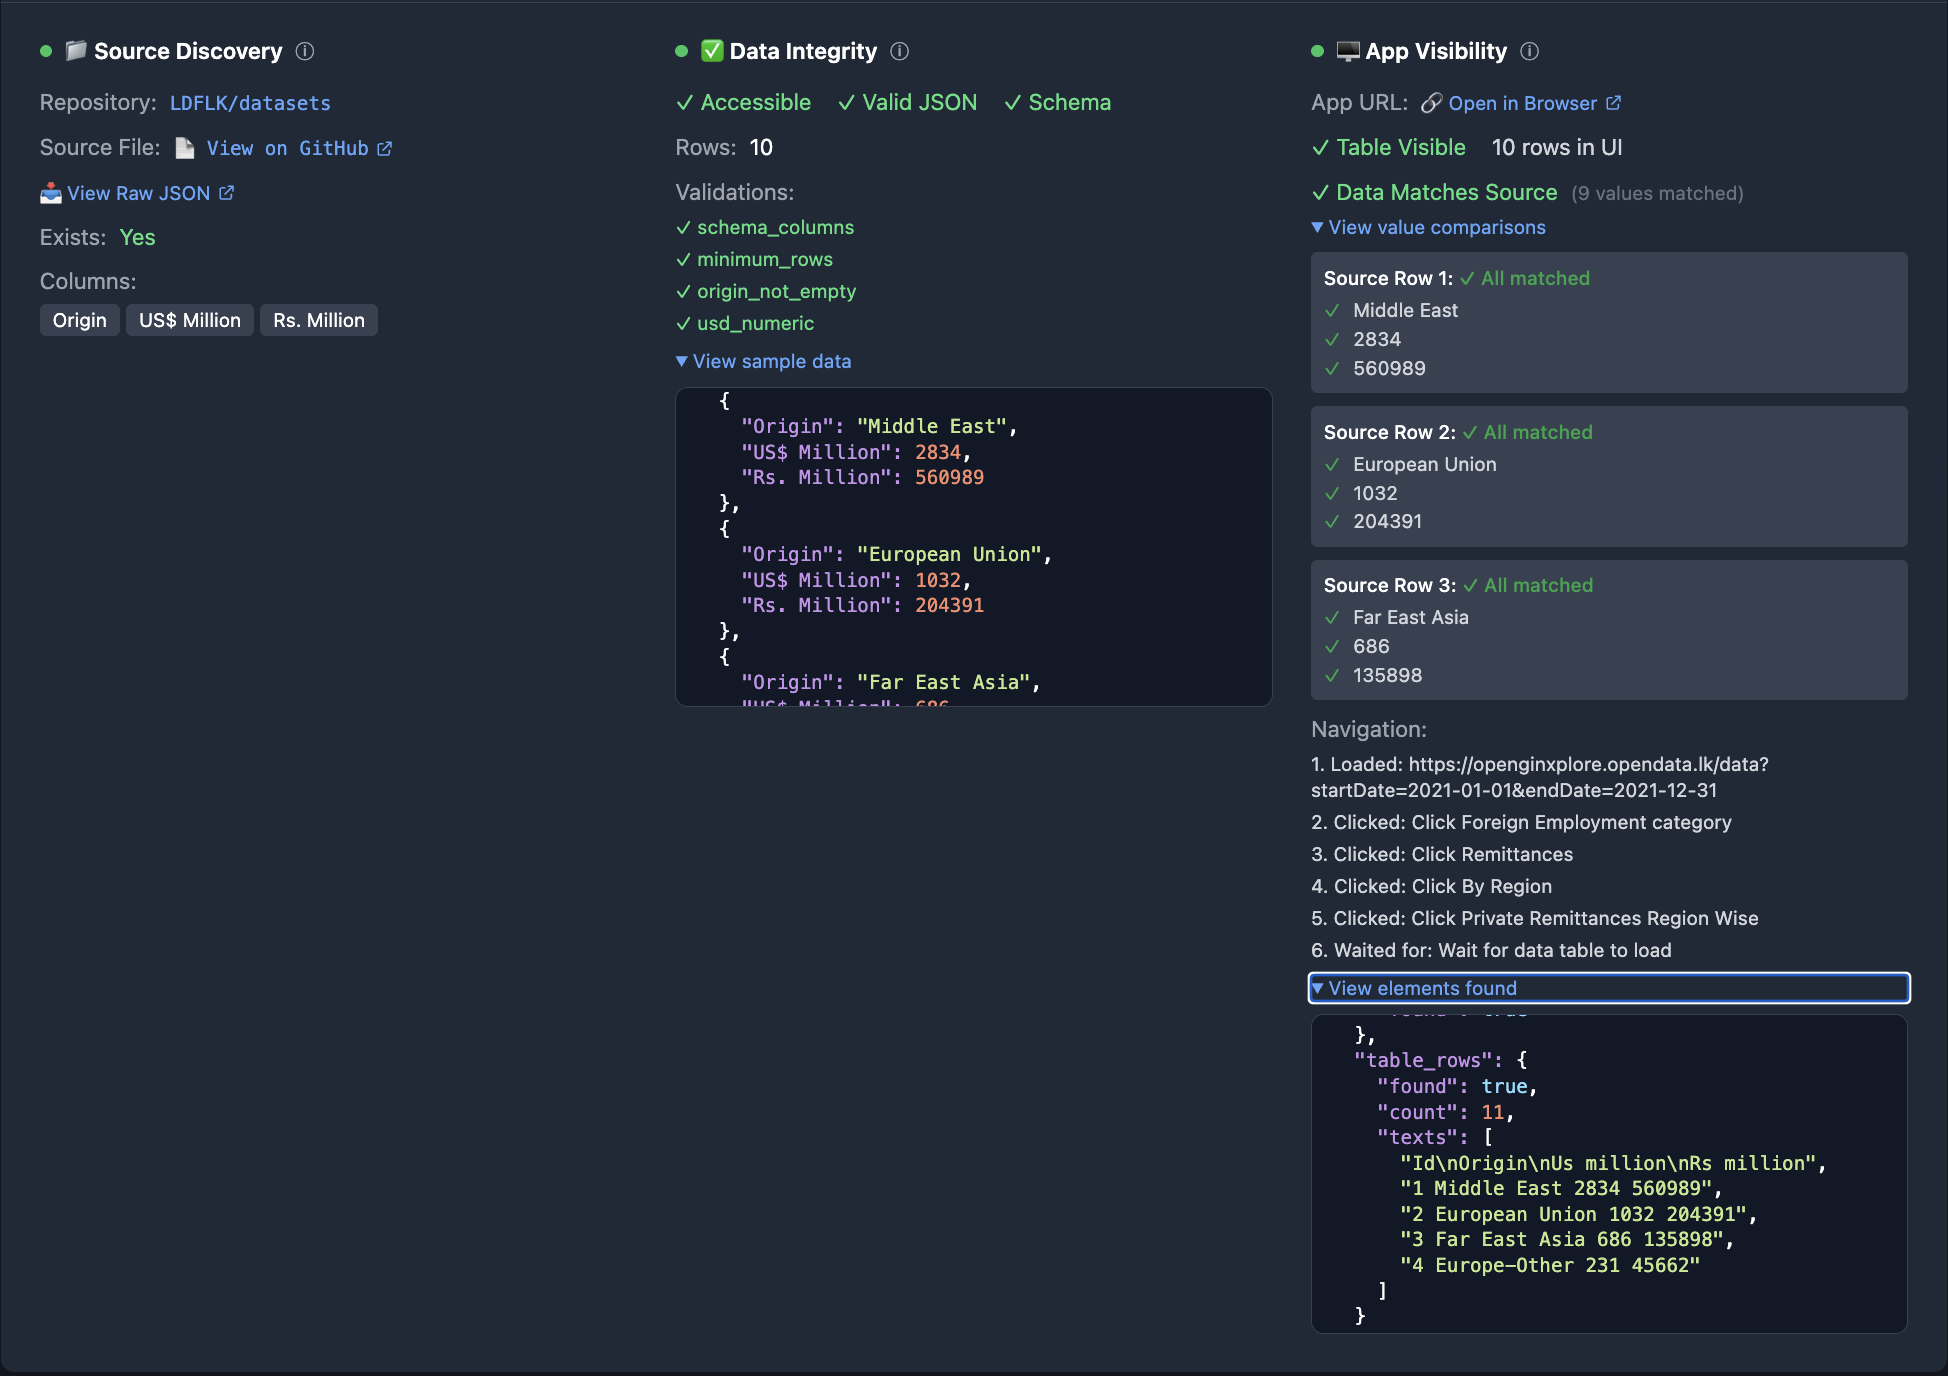
Clicking on a run shows detailed results including configuration, phase results, and validation details for each dataset.
Starting the Dashboard
Development Mode
cd authdata/audit-dashboard

# Install dependencies (first time only)
npm install

# Start development server
npm run dev

# Or on a specific port
npm run dev -- -p 3002
Production Build
cd authdata/audit-dashboard

# Build for production
npm run build

# Start production server
npm run start

# Or on a specific port
npm run start -- -p 3002
Accessing the Dashboard
Open your browser to:
- http://localhost:3000 (default port)
- http://localhost:3002 (if using alternate port)
Dashboard Pages
Home Page (/)
The home page displays a list of all audit runs.
Features:
- List of audit runs sorted by date (newest first)
- Pass/fail status indicator
- Quick summary (actions, datasets passed)
- Click to view run details
Information Displayed:
| Field | Description |
|---|---|
| Run ID | Unique identifier (e.g., audit_20260131_093427) |
| Started | Timestamp when audit began |
| Status | Overall pass/fail status |
| Actions | Total actions (successful/failed) |
| Datasets | Datasets passed/total |
Run Details Page (/runs/[id])
Detailed view of a specific audit run.
Sections:
Summary Panel
- Run ID and timestamps
- Configuration (datasets, years, phases)
- Overall statistics
Dataset Results
- List of all datasets with pass/fail status
- Click to expand dataset details
Action Timeline
- Chronological list of all actions
- Color-coded by status (green=success, red=failure)
- Click to expand action details
Action Details (Expanded)
- Full request information (method, URL, headers)
- Full response information (status, headers, body)
- Extraction results (query, result)
- Duration and error messages
Dashboard Components
ActionTimeline
Displays a chronological timeline of all audit actions with expandable details showing request/response data.
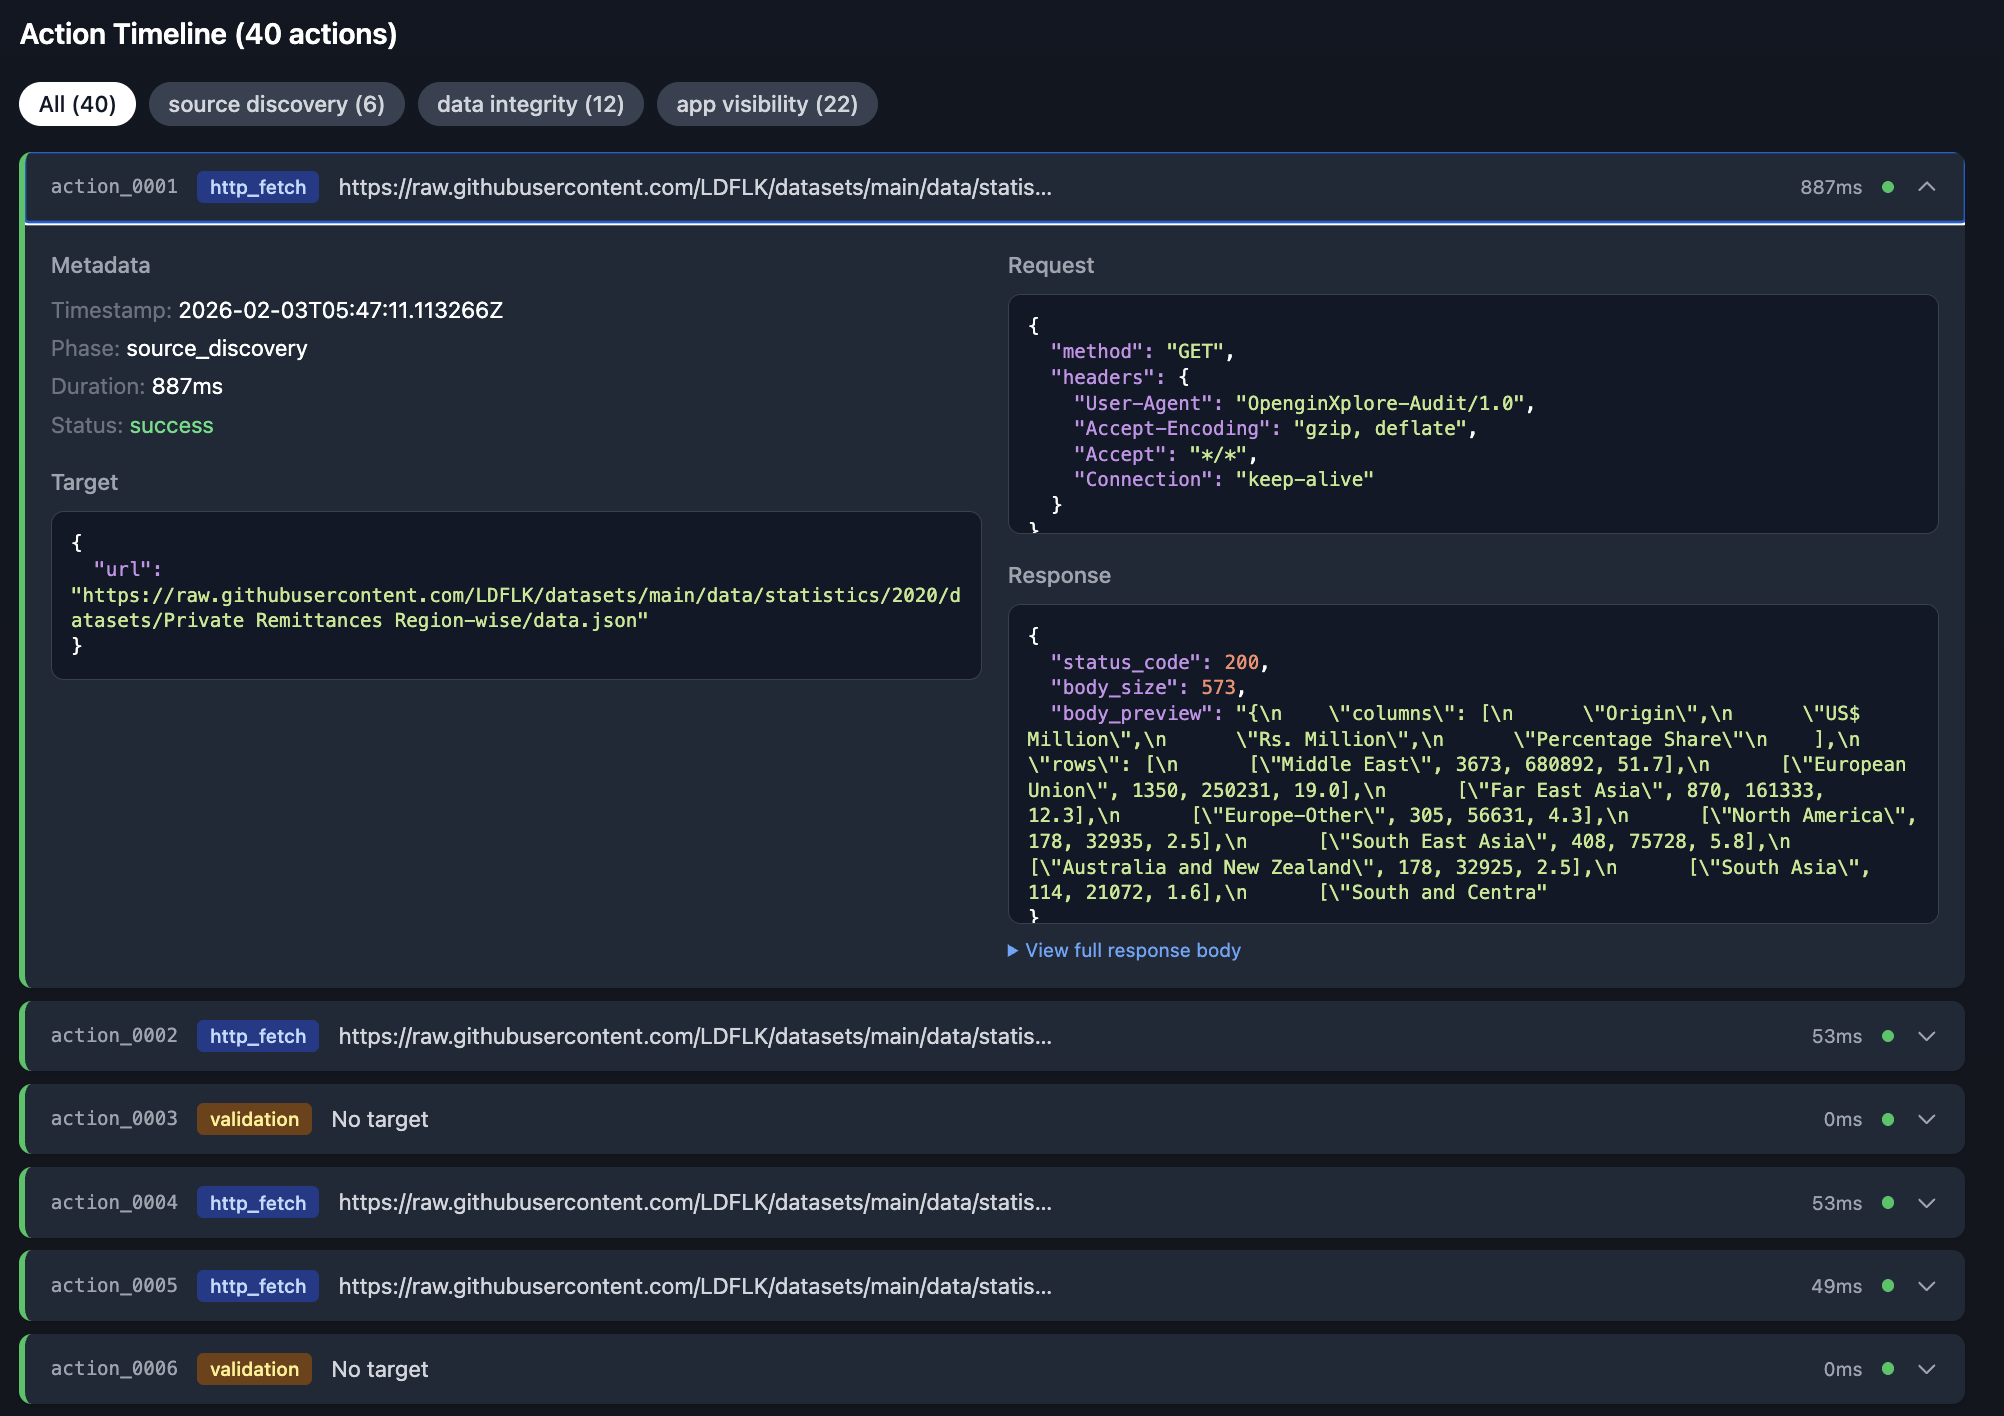
Features:
- Phase filtering (source_discovery, data_integrity, app_visibility)
- Status filtering (success, failure)
- Expandable action details with full request/response data
- Duration tracking for each action
AuditReport
Displays the summary report with pass/fail indicators for each dataset, showing the three-phase audit results (Source Discovery, Data Integrity, App Visibility).
DataViewer
Syntax-highlighted JSON viewer for request/response data, sample data comparison, and navigation steps with expandable element details.
Features:
- Syntax highlighting for JSON data
- Sample data preview with source/UI comparison
- Navigation step tracking
- Expandable sections for detailed inspection
Data Flow
Configuration
Audit Results Path
The dashboard looks for audit results in a relative path. Configure in lib/data.ts:
// Default configuration
const AUDIT_RESULTS_DIR = path.join(
  process.cwd(),
  '..',
  'audit-engine',
  'audit-results'
);
Customizing the Path
To use a different results directory:
// Custom path
const AUDIT_RESULTS_DIR = process.env.AUDIT_RESULTS_DIR ||
  path.join(process.cwd(), '..', 'audit-engine', 'audit-results');
Then set the environment variable:
export AUDIT_RESULTS_DIR="/path/to/audit-results"
npm run dev
Styling
The dashboard uses Tailwind CSS for styling.
Color Scheme
| Element | Color | Purpose |
|---|---|---|
| Success | Green (text-green-600) | Passed actions/datasets |
| Failure | Red (text-red-600) | Failed actions/datasets |
| Info | Blue (text-blue-600) | Informational elements |
| Warning | Yellow (text-yellow-600) | Warnings |
| Background | Gray (bg-gray-50) | Page background |
Troubleshooting
Dashboard Shows "No Audit Runs Found"
- Verify audit results exist:
ls -la authdata/audit-engine/audit-results/
- Run at least one audit:
cd authdata/audit-engine
python main.py run -d "Top 10 Source Markets" -y 2023
- Check path configuration in
lib/data.ts
Dashboard Won't Start
- Verify Node.js version:
node --version # Should be 18+
- Reinstall dependencies:
rm -rf node_modules
npm install
- Check for port conflicts:
# Use different port
npm run dev -- -p 3002
Actions Not Loading
- Check actions.json exists:
cat authdata/audit-engine/audit-results/<run_id>/actions.json
- Verify JSON is valid:
python -m json.tool authdata/audit-engine/audit-results/<run_id>/actions.json
Styling Issues
- Clear Next.js cache:
rm -rf .next
npm run dev
- Rebuild Tailwind:
npm run build